The Adjust display window
This window allows to adjust the contrast of the dataset individually for each color channel. The intensity values for the currently shown slice can be checked in the histogram at the bottom of the window.
A brief demonstration is available in the following video:
 https://youtu.be/WhpzGMyslZU
Back to Index --> User Guide --> Panels --> View settings
Contents
-
Parameters -
Histogram at the bottom of the window
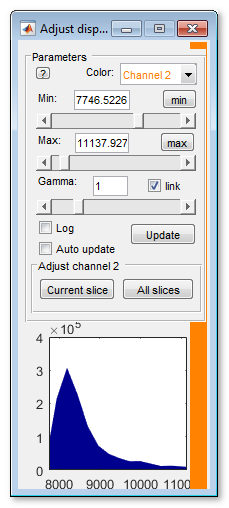
Parameters
List of widgets:
| Color channel combobox | choose color channel for adjustment |
| Min slider and editbox
define the black point 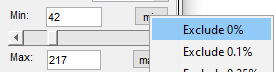 |
selection the black point; all intensities below this value will be
rendered as black.
The  right mouse click above the slider sets its value to 1. right mouse click above the slider sets its value to 1.
Note! it is also possible to set this value using the  left mouse click on the
histogram plot at the bottom of the window left mouse click on the
histogram plot at the bottom of the window
Use the min button to find minimal intensity value for the selected color channel and assign it to black. Additionally, right mouse click over the button
opens a menu allowing to define the black point by excluding % of
points from the from the historam of intensities.
The black point intensity can be directly entered in the editbox above the slider; the negative values can also be used. |
| Max slider and editbox
define the black point 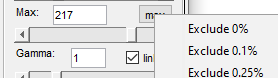 |
selection the white point; all intensities above this value will be rendered as pure color or white.
The right mouse click above the slider sets its value to maximal posible
for the current image class.
Note! it is also possible to set this value using the right
mouse click on the histogram plot at the bottom of the
window
Use the max button to find maximal intensity value for the selected color channel and assign it to white. Additionally, right mouse click over the button opens a menu allowing to define the
white point from the historam of intentities.
The white point intensity can be directly entered in the editbox above the slider; values above the maximal value of the image class can also be used. |
| Gamma | allows modification of gamma parameters. Gamma values below 1 enhance
high intensity values, and Gamma values above 1 enhance low intensity
values.
The right mouse click above the slider sets this value to 1% |
| [✓] Link checkbox | links all color channel so that changing of the
Min/Max/Gamma sliders and editboxes affects all color channels at the same time
|
| [✓] Log checkbox | defines type of histogram representation in the histogram plot: linear or logarithmic scale |
| [✓] Auto update checkbox | switches ON automatic update of the histogram.
When enabled the histogram is updated after each slice change. Warning! Switching on the automatic update of the histogram may significantly decrease rendering of images |
| The Update button | update the histogram for the currently shown slice |
| The Current button | recalculate intensities of the selected color channel (the Channel combobox)
with parameters specified in the dialog for the currently shown slice.
The intensities below the Min value become black and the intensities above the Max value
become white.
The contrast adjustment of a single slice is not logged in the log list see the Log button description. |
| The All slices button | recalculate intensities of the selected color channel (the Channel ▼ dropdown) with parameters specified in this dialog for all slices. The intensities below the Min value become black and the intensities above the Max value become white |
Histogram at the bottom of the window
The histogram shows the plot with intensity values in the X-axis and number of pixels for each intensity value in the Y-axis. Note! The histogram is calculated from the image shown in the Image View panel - not from the full slice!
The adjustments made with Gamma are not shown in the histogram plot.
It is possible to change Min and Max values for the intensities by manual numerical input, using the slider or with the right and left mouse click within the histogram plot.
Back to Index --> User Guide --> Panels --> View settings