Statistics for Mask or Model Objects
Back to MIB | User interface | Menu | Mask Menu (Model Menu)
Overview
This dialog provides access to statistic values for shapes and intensities of model and mask 2D or 3D objects.
Workflow in a nutshell
- Select material or mask in the Objects panel
- Define 2D or 3D shape of the objects to detect in the Shape panel
- Choose to detect object shapes or intensities in the Mode panel
- Select the property to quantify ()
Info
For multiple properties to quantify check
- Hit the button to start quantification
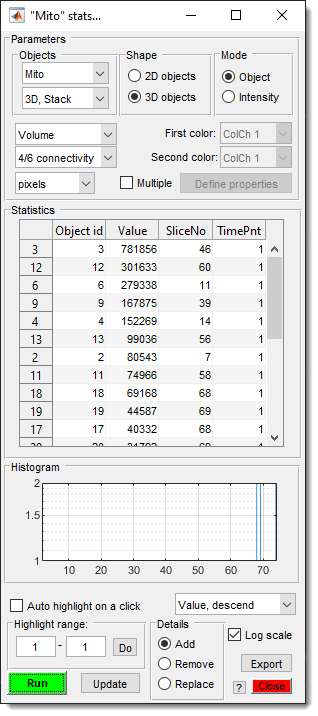
Parameters Panel
- The Objects panel: use combo boxes to select the material for analysis and dataset type: current slice (2D Slice), current Z-stack (3D Stack), or whole volume (4D Dataset). For models with over 255 materials, the upper combo box includes a Model option, quantifying all materials at once with a single value per material.
- The Shape panel: select object type to detect: 2D or 3D.
- The Mode panel: in Object mode, statistics are based on shape properties; in Intensity mode, they’re based on image intensities behind objects.
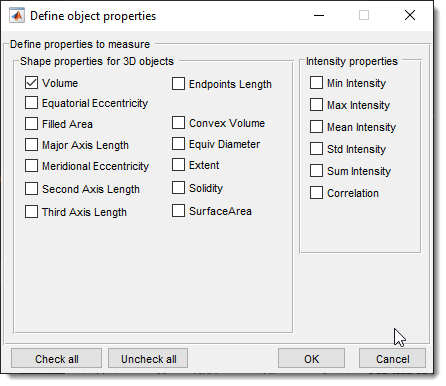
- : select properties to measure (see below).
Warning
EndpointsLength requires 1-pixel-wide lines with 8/26 connectivity.
- : defines object separation
- 4/8 connectivity combine pixels that touch each other at North, West, South, East sides for 2D and also Top, Bottom for 3D objects
- 6/26 connectivity combine pixels that touch as in 4/8 connectivity plus those that touch at 45 degrees
- : Specify channel for intensity analysis.
- : For correlation intensity analysis.
- : choose pixels or physical units.
Warning
Some parameters are pixel-only. Properties like MeridionalEccentricity, EquatorialEccentricity, MajorAxisLength, SecondAxisLength, ThirdAxisLength, EquivDiameter, and Surface Area for 3D objects in physical units require isotropic voxels.
- : Enables detection of multiple properties simultaneously, selected via the button.
The Statistics table
The Statistics table displays calculated values.
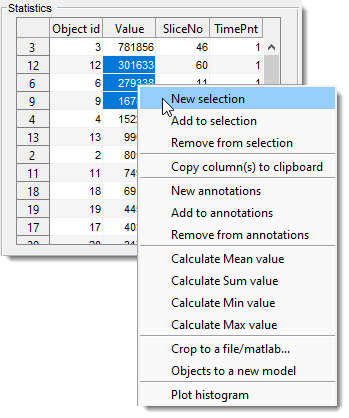
Sort (via )
or select objects (
- New selection: creates a new selection from highlighted objects.
- Add to selection: adds highlighted objects to the selection.
- Remove from selection: removes highlighted objects from the selection.
- Copy column(s) to clipboard: copies highlighted column(s) to the system clipboard.
- New annotations: adds labels to selected objects, accessible via Menu→Models→Annotations→List of annotations or
Segmentation panel→Segmentation tools→Annotations. - Add to annotations: adds highlighted objects to the annotation list.
- Remove from annotations: removes highlighted objects from the annotation list.
- Calculate Mean: calculates and copies the average value of highlighted objects to clipboard.
- Calculate Sum: calculates and copies the sum of highlighted objects to clipboard.
- Calculate Min: calculates and copies the minimal value of highlighted objects to clipboard.
- Calculate Max: calculates and copies the maximal value of highlighted objects to clipboard.
- Crop to a file/MATLAB: crops the dataset based on 3D objects, with options for margins, Model/Mask cropping, and export to file or MATLAB.
Details on Crop to a file/MATLAB
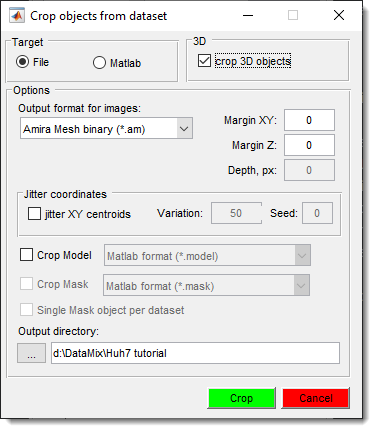
- check to export 3D objects
- : extend bounding box in XY by specified pixels.
- : extend bounding box in Z by specified pixels.
- : randomly shifts crop window (controlled by and ; use 0 for random seed).
- : include model cropping.
- : include mask cropping.
- : keep only the main object in Mask crop (enabled for mask-derived objects).
Exported Structure (e.g.,
Filename_IndexOfTheObject):-
.img: Cropped image [1:height, 1:width, 1:colors, 1:stacks].-
.meta: Metadata for cropped image.-
.Model: Structure with .model, .modelMaterialNames, .modelMaterialColors.-
.labelText: Cell array with annotations.-
.labelPosition: Matrix with annotation coordinates [z, x, y].-
.Mask: Mask layer matrix [1:height, 1:width, 1:stacks].
Import back using:
- Menu → File → Import image from... → MATLAB (e.g., Filename_IndexOfTheObject.img, Filename_IndexOfTheObject.meta).
- Menu → Models → Import model from MATLAB (e.g., Filename_IndexOfTheObject.Model).
- Objects to a new model: Generates a new model with each selected object assigned a unique index. Demo
- Plot histogram: Draws a histogram bar plot from selected data.
Histogram panel
Histogram plot shows distribution of statistics from the table, with normal or
logarithmic scale (via ).
Use to modify
click to define minimum value for objects click to define maximum value for objects
: highlights selected objects
in the Image View panel.
Ctrl +
- : changes table sorting.
- + : specify minimum and maximum values for objects and highlights objects within that range
- The Details panel: defines selection action (add, remove, replace Selection layer).
- : exports statistics to Excel or MATLAB.
File formats for saving stats
- Excel format (*.xls) export in Microsoft Excel format
- Comma-separated values (*.csv) export as comma-separated format
- MATLAB format (*.mat) - standard MATLAB format, including
.PixelIdxListand.BoundingBoxfields - MATLAB format minimalistic (*.mat) - standard MATLAB format, excluding
.PixelIdxListand.BoundingBoxfields
- : starts quantification.
Statistical properties of 3D objects
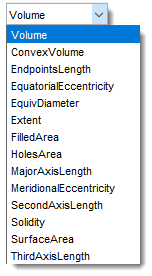
- Area: Total pixels (~volume) within 3D objects.
- Endpoints Length: Distance between endpoints of 1-pixel-wide lines (use Membrane ClickTracker with Straight line, Width=1). Calculated in image units.
- EquatorialEccentricity: Eccentricity of the section through the second longest and shortest axes (1 = line, 0 = sphere).
- FilledArea: Total pixels (~volume) within filled 3D objects.
- Holes Area: Total pixels (~volume) of cavities within 3D objects.
- MajorAxisLength: Length of the major axis in pixels.
- MeridionalEccentricity: Eccentricity of the section through the longest and shortest axes.
- SecondAxisLength: Length of the second major axis in pixels.
- ThirdAxisLength: Length of the minor axis in pixels.
Statistical properties of 2D objects
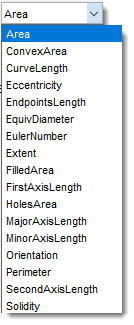
- Area: Total pixels within 2D objects.
- ConvexArea: Total pixels of the smallest convex polygon containing the object.
- CurveLengthInPixels: Length of thinned curves (closed or open) in pixels. Requires thinning (Menu → Selection → Morphological operations) and branch point removal.
- CurveLengthInUnits: Length of thinned curves in physical units. Requires thinning and branch point removal.
- Eccentricity: Ratio of foci distance to major axis length of an ellipse with the same second-moments (0 = circle, 1 = line).
- Endpoints Length: Distance between endpoints of 1-pixel-wide lines (use Membrane ClickTracker with Straight line, Width=1; thin with Brush size 1 or Menu → Selection → Morphological 2D operations → Thin). Calculated in image units.
- EquivDiameter: Diameter of a circle with the same area as the object (
sqrt(4*Area/pi)). - EulerNumber: Number of objects minus holes (e.g., 1 hole = 0, 2 holes = -1).
- Extent: Ratio of object pixels to bounding box pixels (Area / bounding box area).
- FirstAxisLength: Real length of the major 2D axis (unlike MajorAxisLength for ellipse).
- FilledArea: Total pixels of the filled object.
- Holes Area: Total pixels within holes.
- MajorAxisLength: Length of the major axis of an ellipse with the same second central moments (pixels).
- MinorAxisLength: Length of the minor axis of an ellipse with the same second central moments (pixels).
- Orientation: Angle (-90° to +90°) between x-axis and major axis of an ellipse with the same second-moments.
- Perimeter: Distance around the object boundary (sum of distances between adjoining border pixels).
- SecondAxisLength: Real length of the minor 2D axis (unlike MinorAxisLength for ellipse).
- Solidity: Proportion of convex hull pixels in the object (Area / ConvexArea).
Statistical properties of intensities of 2D/3D objects
Calculated when the Intensity radio button in the Mode panel is selected.
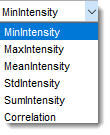
- MinIntensity: Minimal image intensity within 2D/3D objects.
- MaxIntensity: Maximal image intensity within 2D/3D objects.
- MeanIntensity: Average image intensity within 2D/3D objects.
- StdIntensity: Standard deviation of image intensity within 2D/3D objects.
- SumIntensity: Sum of image intensities within 2D/3D objects.
- Correlation: Correlation between intensities of two selected color channels (see MATLAB’s
corr2).
Back to MIB | User interface | Menu | Mask Menu (Model Menu)