The 3D Lines Tool
Back to MIB | User interface | Panels | Segmentation
3D Lines overview
The 3D lines tool allows drawing lines in 3D space, arranging them as graphs or skeletons. It consists of nodes (vertices) connected by edges (lines). Nodes represent points, and edges represent connections, forming trees—distinct sets of 3D lines—for better organization.
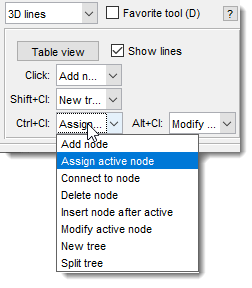
Modify nodes with mouse clicks, extended by key modifiers (, , ) for various actions (see below).
Available actions
- add a new node to the active tree, connecting it to the active point (shown in red).
- assign the closest node to the mouse click as the new active node.
- connect the active node to another existing node.
- remove the closest node, rearranging edges to prevent tree splitting.
- insert a new node after the active node.
- move the active node to a new position with a mouse click.
- add a node to a new, unconnected tree.
- split a tree by deleting the closest node.
Use to toggle visibility of edges in the Image View panel.
Press to open a window with tables describing the 3D lines (see below).
Lines 3D View
List of trees table
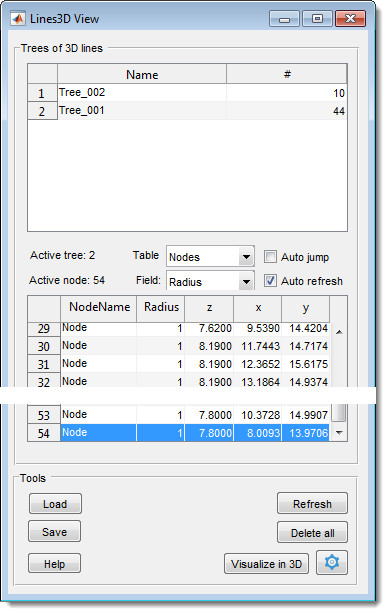
Table with the list of trees
The upper table in the Lines 3D View window lists trees and their node counts. Each tree must have a unique name.
- Rename selected tree: rename the tree (must be unique).
- Find tree by node: find a tree by node index.
- Visualize in 3D selected tree(s): plot selected trees in 3D.
- Save/export selected tree(s): export to MATLAB or save to a file (formats listed in Tools panel below).
- Delete selected tree(s): remove selected trees.
Space between the tables
- Active tree index of the active tree.
- Active node index of the active node.
- select Nodes or Edges for the lower table.
- add an extra field (Radius or Weights by default) to the lower table.
- jump to the selected node and show it in the Image View panel.
- automatically refresh tables (may be slow with many nodes).
Nodes table
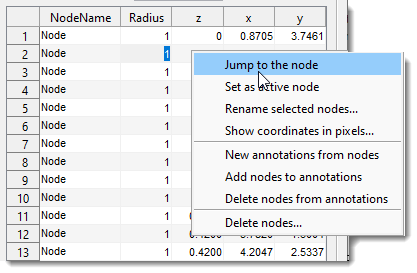
Lists nodes with actions via a popup menu:
- center the selected node in the Image View panel.
- make the selected node active.
- assign a new name.
- show node coordinates in pixels (default is physical units per bounding box).
- generate new annotations from node positions.
- add selected nodes to existing annotations.
- remove selected nodes from annotations.
- delete selected nodes.
Edges table
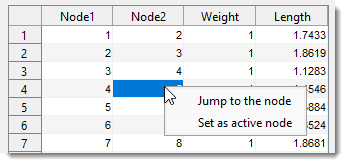
Lists edges with actions via a popup menu:
- : center the selected node in the Image View panel.
- : make the selected node active.
Tools panel
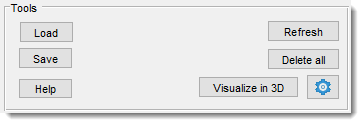
- : load 3D lines from a MATLAB-compatible *.lines3d file.
- : export to MATLAB or save as:
- MATLAB format, *.lines3d: recommended format.
- Amira Spatial graph, *.am: Amira-compatible (binary or ASCII).
- Excel format, *.xls: export Nodes and Edges tables.
- : refresh the tables.
- : delete all 3D lines.
- : plot all trees in 3D.
- : modify color and thickness of 3D lines.
Presets
Use the following key shortcuts to define and restore presets
- Shift+1, Shift+2, Shift+3 - store preset 1, 2, or 3 correspondingly
- 1, 2, 3 - restore preset 1, 2, or 3 correspondingly
Back to MIB | User interface | Panels | Segmentation