Triple Area Intensity
Back to MIB | User Interface | Plugins | Intensity Analysis
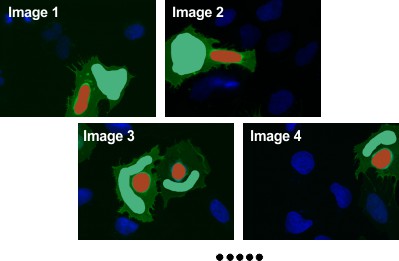
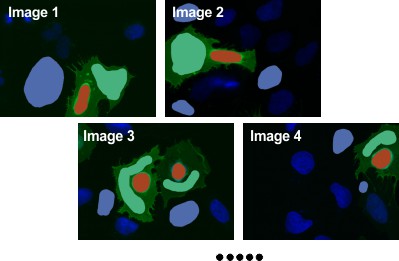
The Triple Area Intensity plugin in Microscopy Image Browser (MIB) calculates image intensities (mean, min, max, or sum) for three areas defined by materials in a model, such as cytosol, nucleus, and background in cells. Results can be displayed in MIB’s Image View panel, stored in the Annotation layer, or saved as an Excel spreadsheet.
Overview
This plugin measures intensities across three model materials, enabling comparisons (e.g., cytosol vs. nucleus) with optional background correction. It supports ratio calculations and visualization of connected areas, making it ideal for quantitative analysis in microscopy datasets.
Usage
The following steps demonstrate how to compare image intensities between cytosol and nucleus, using a background reference.
Access the plugin via: Menu → Plugins → Intensity Analysis → TripleAreaIntensity.
Load Images
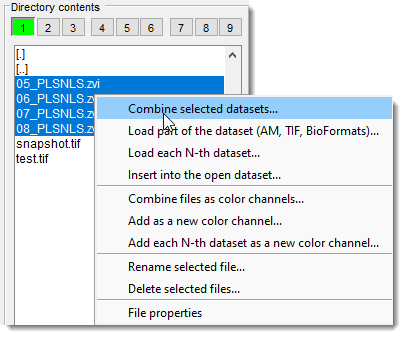
- Highlight files in the Directory Contents panel using Shift +
. and select Combine selected datasetsto load as a 3D/4D stack.
Create segmentation model
Create Model
- Click in the Segmentation panel to start a new model.
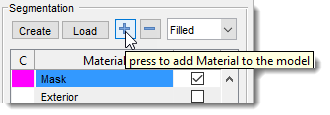 Add Nucleus Material
- Click
+in the Segmentation panel to add a material. - Name the new material as
Nuclei
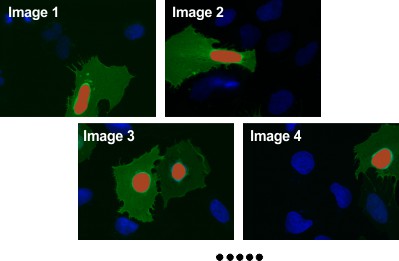 Segment Nuclei
- Use the Brush or Segment-anything model tool in the Segmentation panel to draw nuclei areas.
- Ensure material
Nucleiis selected inAdd to. - Press Shift+A to add drawn areas to
Nucleiacross all slices.
Add Cytosol Material
- Click
+to add another material and rename it toCytoplasm.
 Segment Cytoplasm
- Use the
Brushtool to draw cytoplasm areas, ensuring the number of cytoplasm objects matches the number of nuclei. - Select material
CytoplasminAdd to. - Press Shift+A to add drawn areas to
Cytoplasmacross all slices.
Add Background Material
- Click
+to add a third material and rename it toBackground.
 Segment Background
- Use the
Brushtool to draw areas outside cells for background intensity. - Select material
BackgroundinAdd to, ensuring at least one background area per image. - Press Shift+A to add drawn areas to
Backgroundacross all slices.
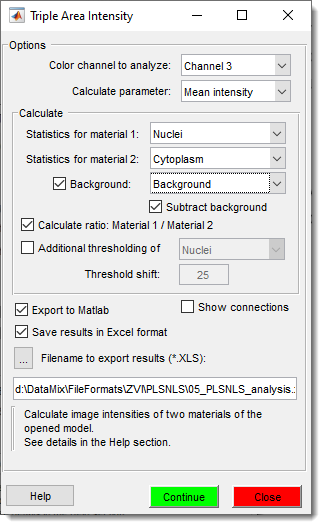
Configure Plugin
- Start the plugin:
Menu → Plugins → Intensity Analysis → TripleAreaIntensity. - Select the color channel and parameter (
Mean,Max,Min,Sum). - Set
Calculate → Statistics for material 1toNucleus. - Set
Calculate → Statistics for material 2toCytoplasm.
Info
The plugin calculate image intensity for the selected color channel under and
- Check
Backgroundand selectBackgroundin the dropdown.
Info
Include Background to compensate for uneven illumination within images
- Optionally check to adjust intensities.
Subtract background
When is in the checked state, the plugin will subtract intensities under background areas from the acquired values
- Check
Calculate ratio: Material 1 / Material 2for ratio output.
Calculate ratio
When is in the checked state, the plugin additionally calculates the ratio of intensities after background subtraction.
- Specify a filename for Excel export.
Run Analysis
Click to calculate intensities.
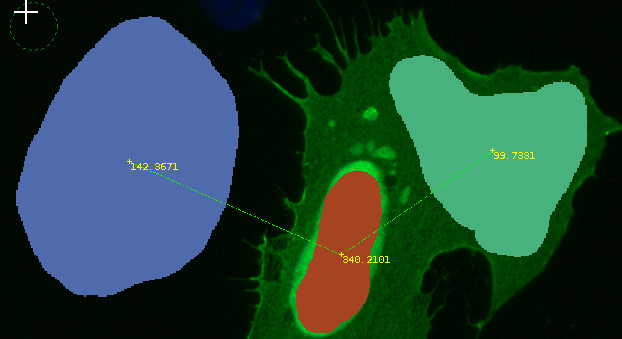
Results appear in the Image View panel (e.g., Background: 142.3671, Nucleus: 340.2101, Cytosol: 99.7331, with background subtracted).
Annotations are stored in Menu → Models → Annotations.
Show connections
If Show connections is enabled, connected areas are linked in the Mask
layer (clear via Menu → Mask → Clear mask).
Warning
Ensure the number of cytosol objects matches nuclei for accurate pairing.
Use Show connections to verify object relationships visually.
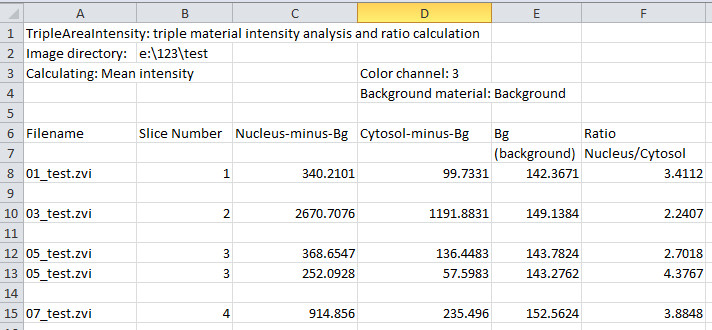
Snapshot of results exported using the Microsoft Excel format
Additional Options
: apply thresholding to a material based on background intensity plus a value.
: send results to MATLAB’s main workspace as a structure.
: visualize paired areas in
the Mask layer, removable via Menu → Mask → Clear mask.
Credits
Written by Ilya Belevich, University of Helsinki
- Version: 1.3, 25.11.2022
- Email: ilya.belevich@helsinki.fi
- Web: https://researchportal.helsinki.fi/en/persons/ilya-belevich
Includes code by Gunther Struyf.
Back to MIB | User Interface | Plugins | Intensity Analysis