Granularity
Back to MIB | User Interface | Plugins | Organelle Analysis
Overview
The Granularity plugin in Microscopy Image Browser (MIB) performs
analysis of endoplasmic reticulum (ER) models to quantify the granularity of structures,
i.e. ratio between sheets and tubules.
It supports customizable subarea selection, structuring element configuration,
and export of results for further analysis.
Usage
Access the plugin via:
Menu → Plugins → Organelle Analysis → Granularity.
Follow these steps to analyze granularity:
Load Images and models of ER

Start the plugin:Menu → Plugins → Organelle Analysis → Granularity.
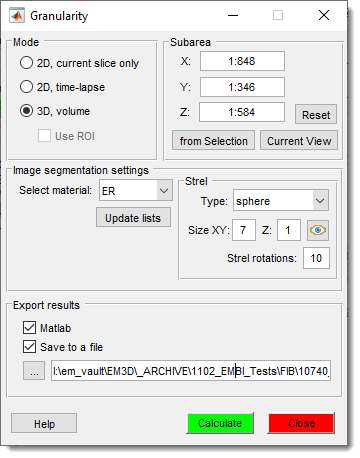
Select Analysis Mode:
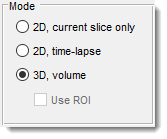
2D, current slice only- use to preview 2D mode on the current slice2D, time-lapse- apply 2D analysis for the whole dataset3D, volume- apply 3D strel elements to do calculations in 3D space
Define Subarea:
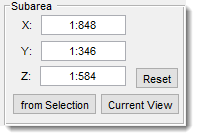
- Use to update the and fields using the currently shown area.
- Click to restrict analysis to a selected area
(drawn via MIB’s
Selectiontools). - Adjust coordinates manually in the subarea edit boxes or click to revert to the full image.
Select Materials:
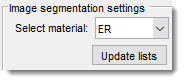
- Click to get the list of materials from the current model and update the dropdown.
- Use to select material
Configure Structuring Element (Strel)
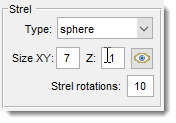
- Use to select type of the structural element to use
- Set (XY plane) and (for 3D) to define the shape of the structural element.
- Specify for number of strel rotations to use.
Info
Higher values ensure better results, but with increase of computation time.
- Click
Preview Strelto visualize the structuring element before analysis.
Export Results:
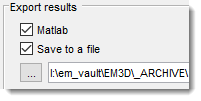
- Check to export results to the main MATLAB workspace as a structure.
- Check to save results in MATLAB of EXCEL formats
- Click to choose an output file (
.xlsxfor Excel or.matfor MATLAB).
Run Analysis:
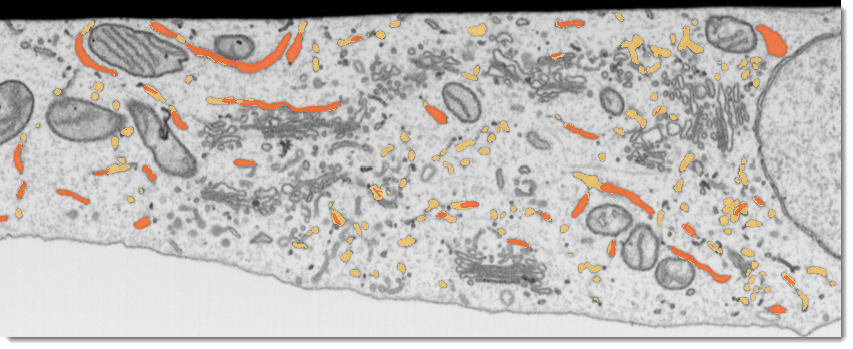
- Click to compute granularity metrics.
- Results are displayed in the Image View panel.

Credits
- Author: Ilya Belevich, University of Helsinki (ilya.belevich@helsinki.fi)
- Part of: Microscopy Image Browser (https://mib.helsinki.fi)
Back to MIB | User Interface | Plugins | Organelle Analysis